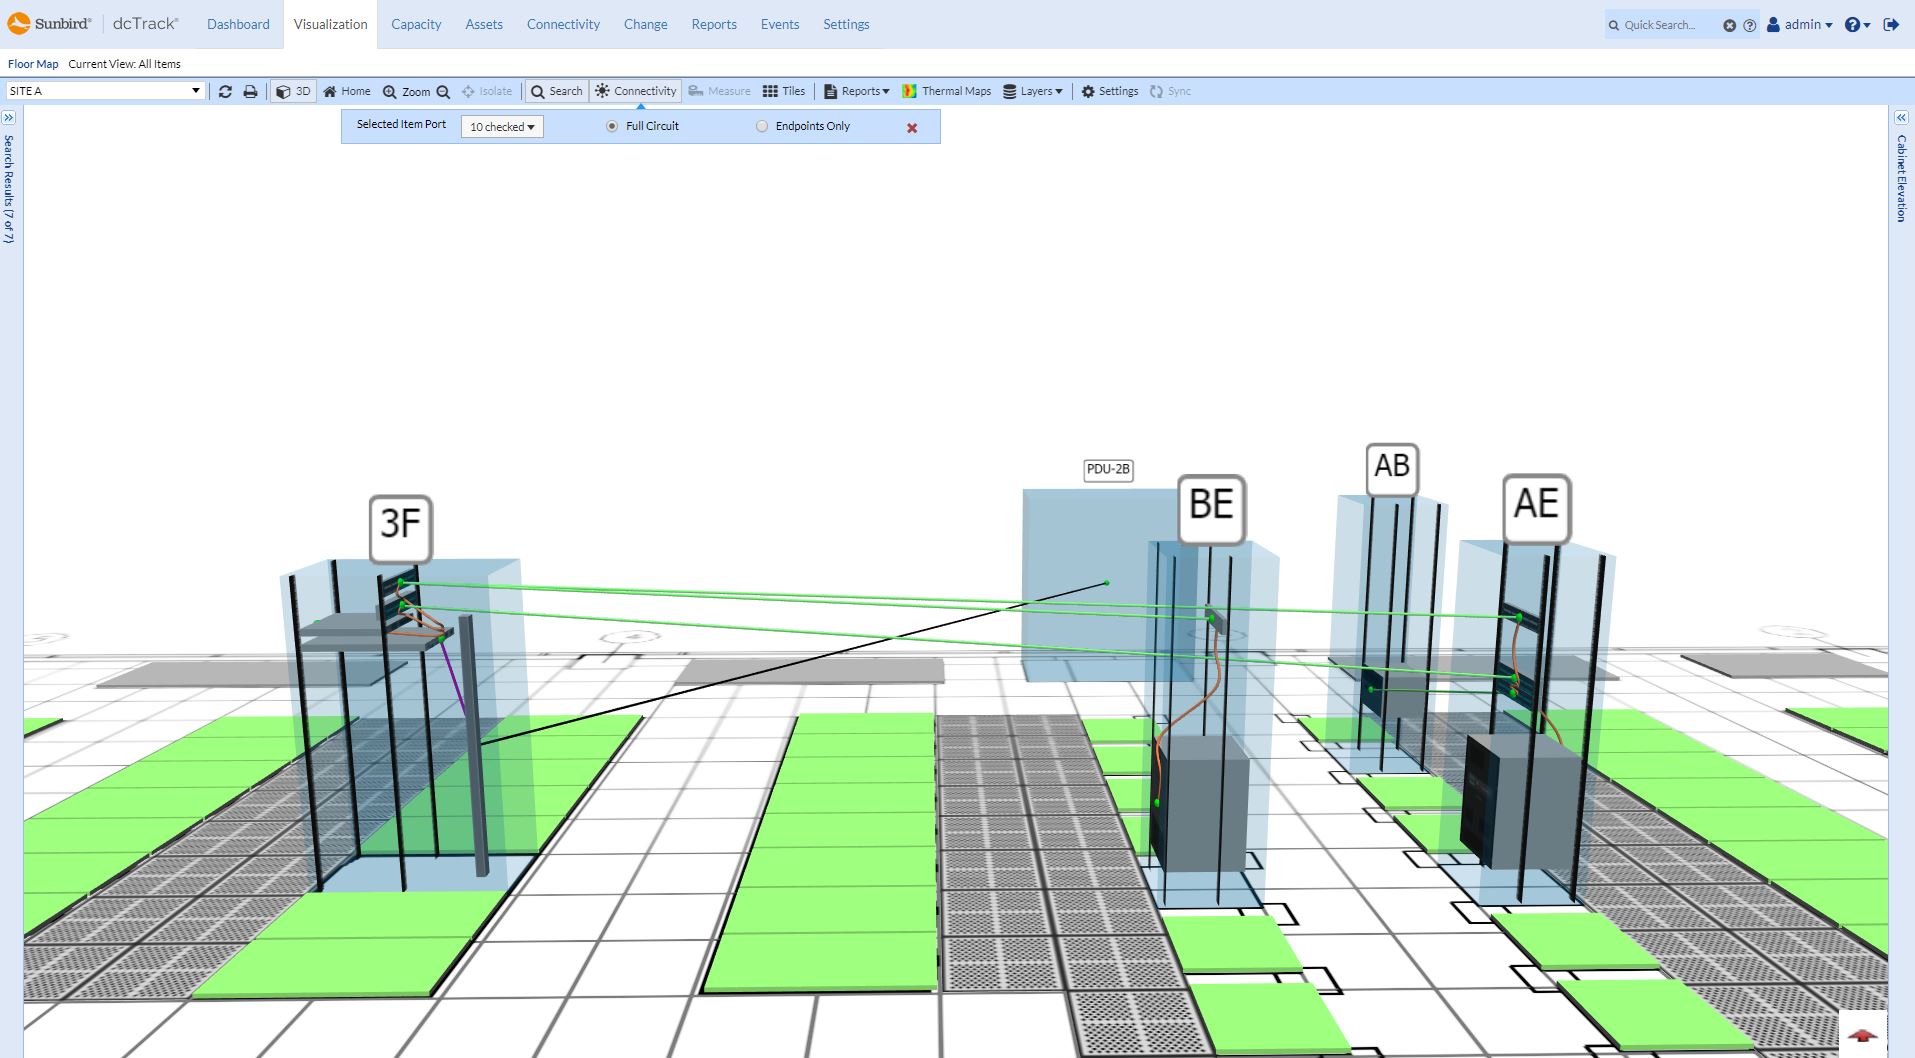
Sunbird's 3D data center floor map visualizations display data and power connectivity for multiple ports. You can view the full circuit or just the connections between the endpoints only.
Read More
Screenshots
Sunbird's 3D data center floor map visualizations display data and power connectivity for multiple ports. You can view the full circuit or just the connections between the endpoints only.
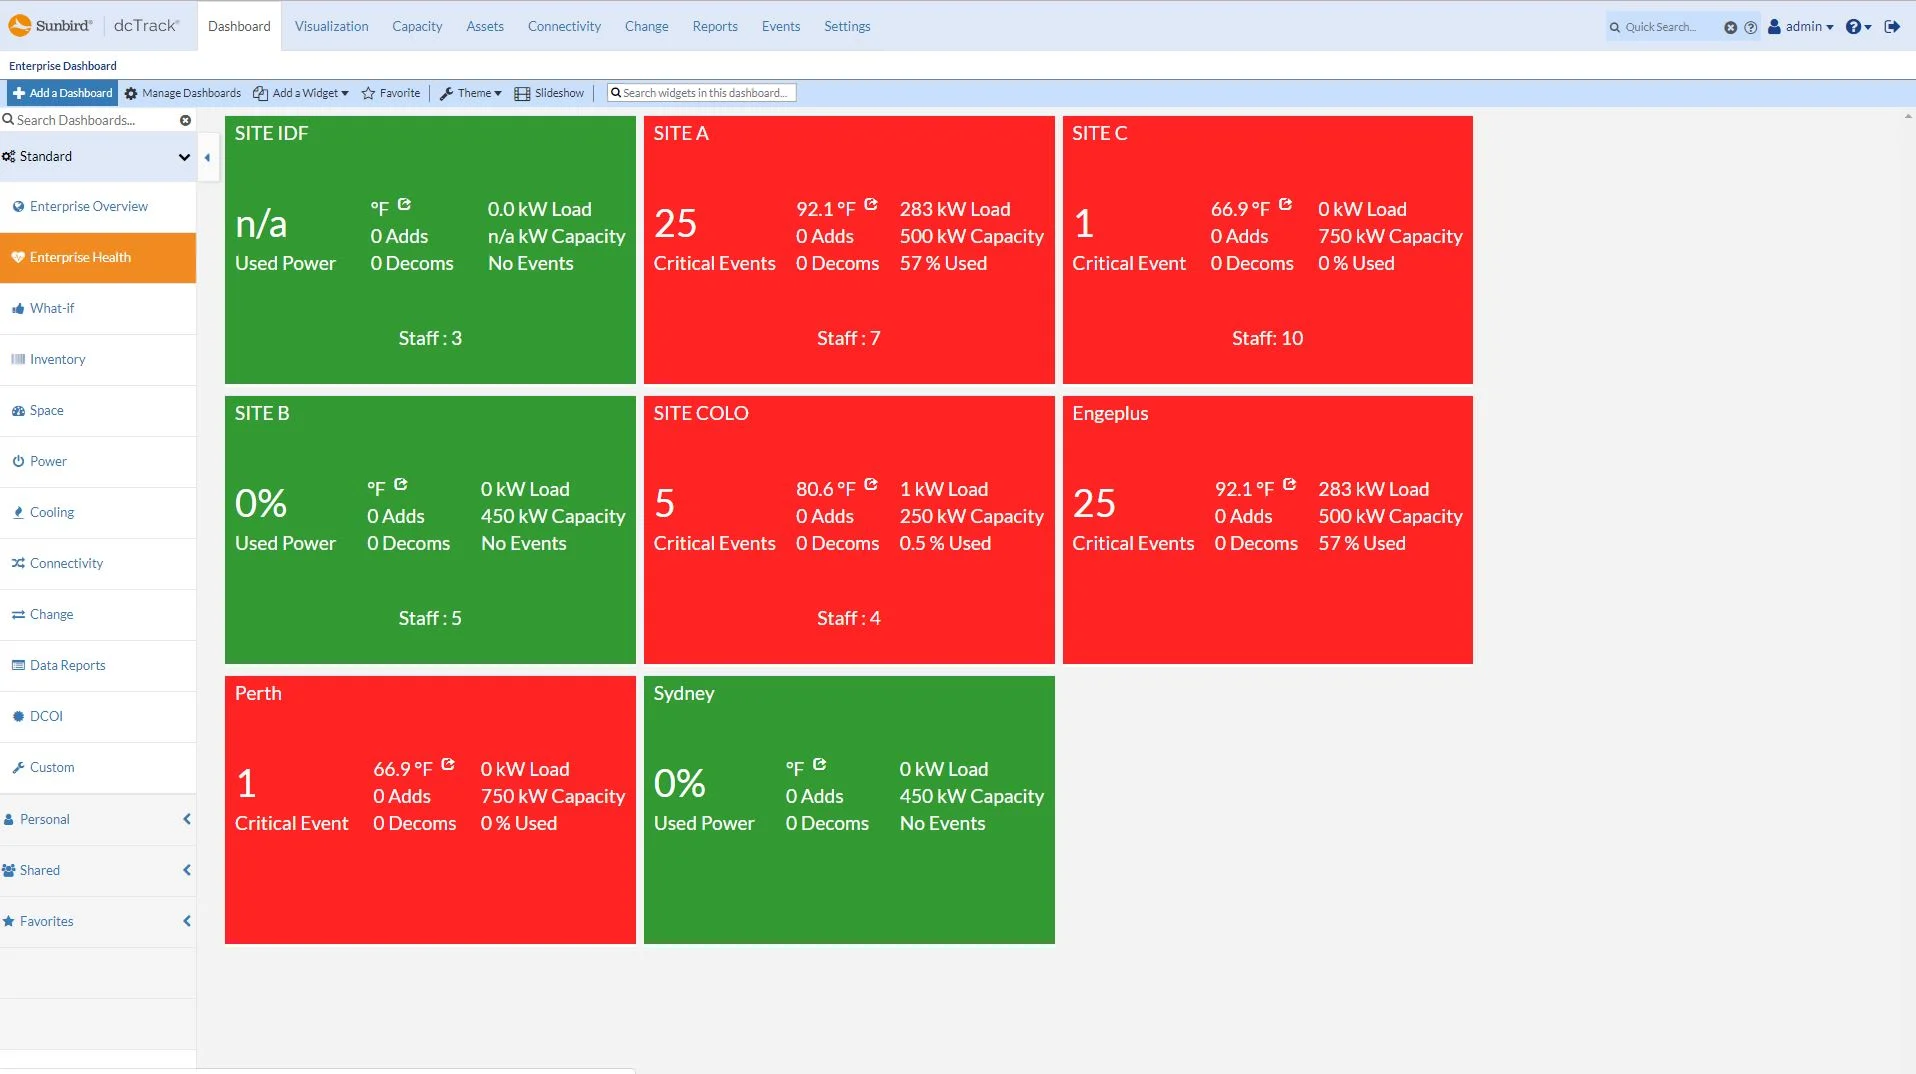
Read MoreThe Enterprise Health Dashboard provides tile widgets that display color-coded warning and critical health event data for locations in your enterprise.
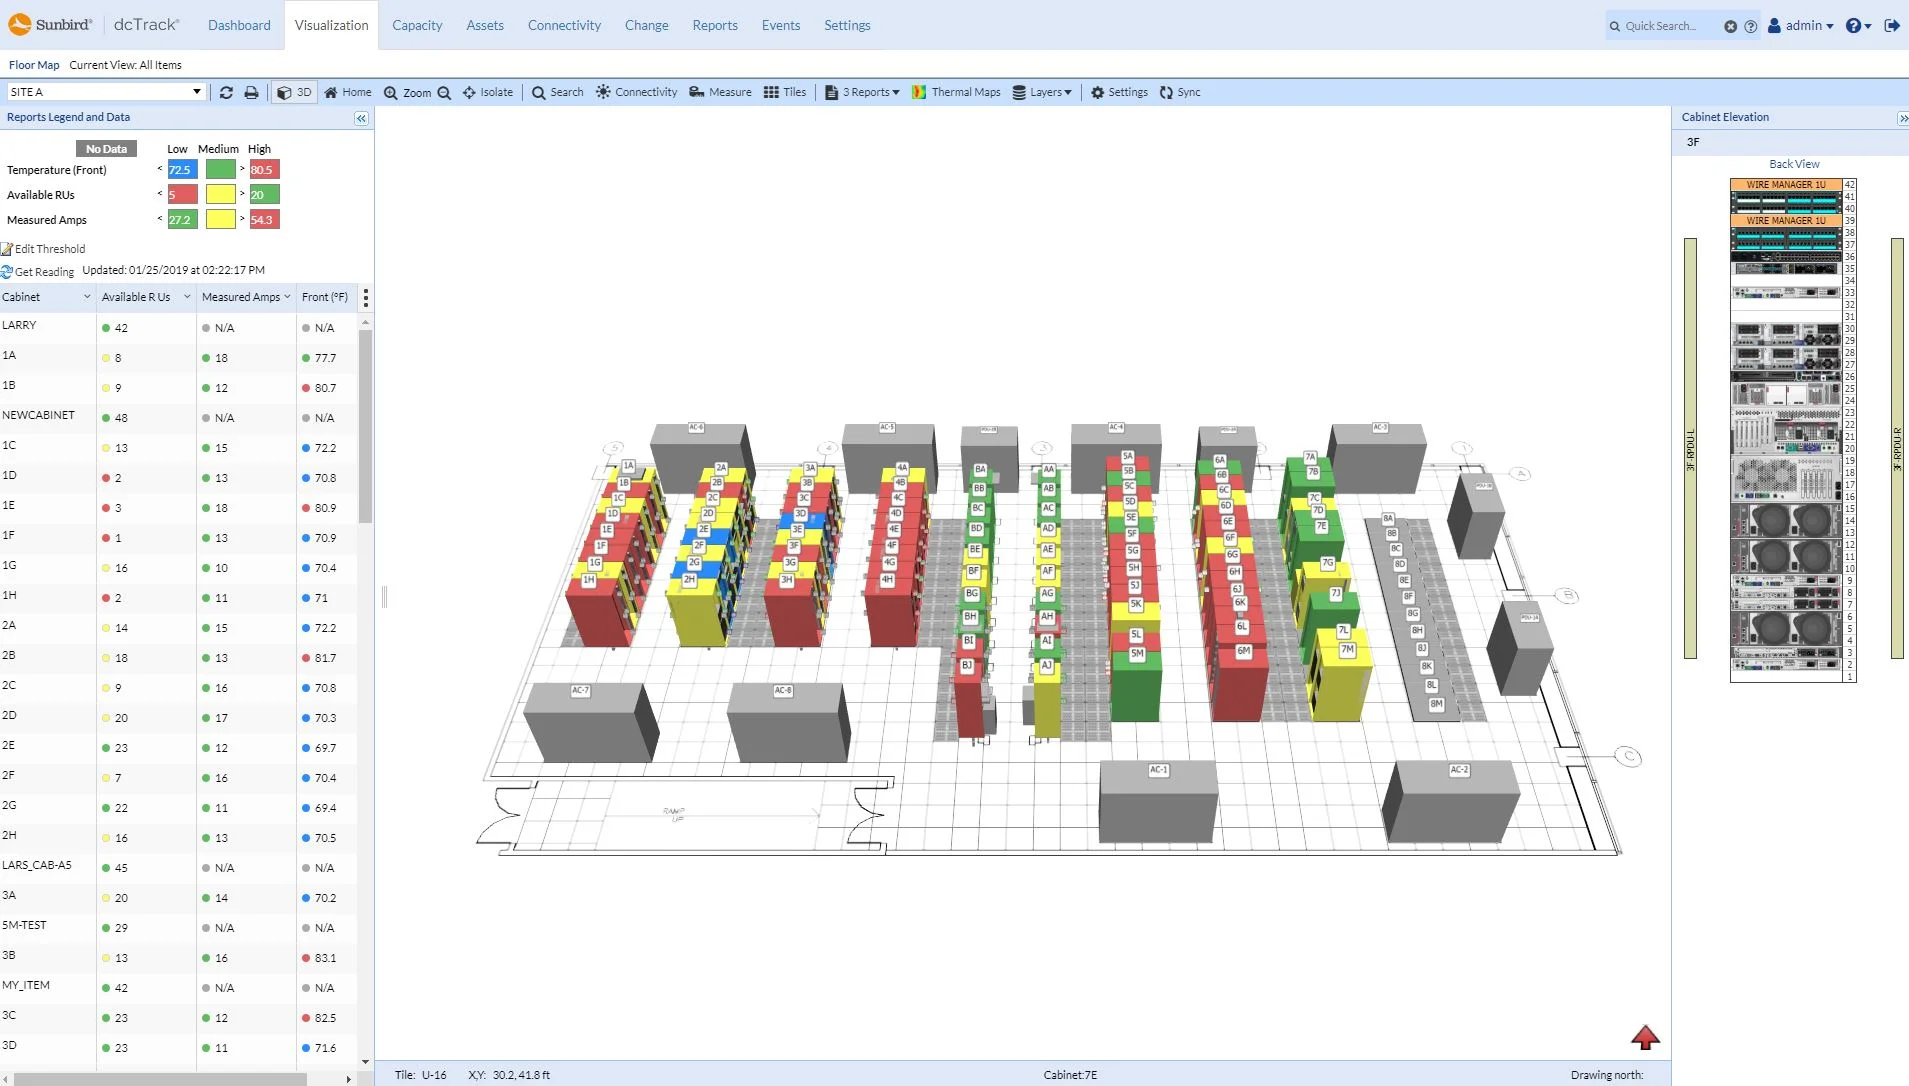
Read MoreSunbbird's 3D floor map visualizations enable you to overlay multiple data center capacity, environmental, and power reports to correlate data.
Read More